Wall Street Sees Rare Technical Signal After Massive Market Drop
New York, Sunday, 8 November 2026.
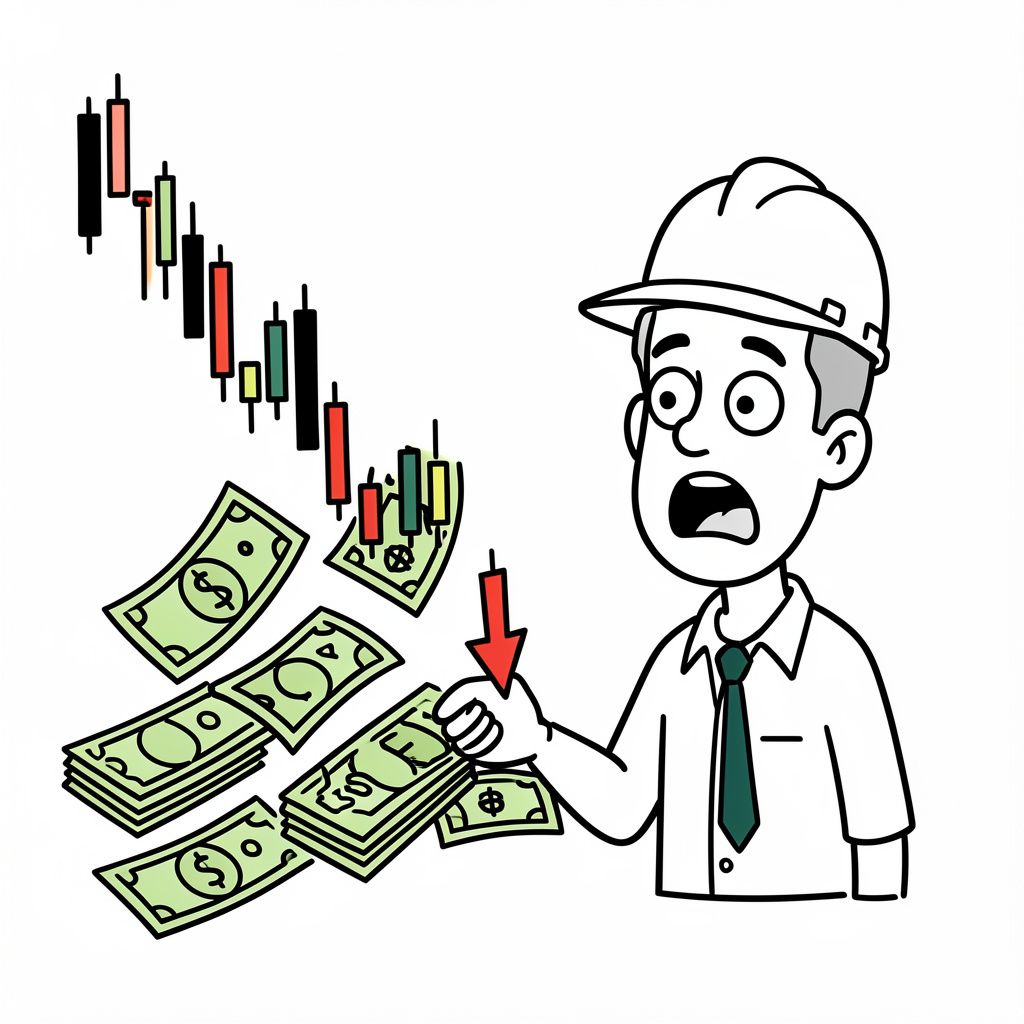
Appearing for only the fifth time in 30 years, a rare market signal has triggered following a steep $2.3 trillion tech sell-off, pointing to an impending directional shift for equities.
The Fifth Occurrence of a Rare Technical Signal
A rare technical pattern on Wall Street has manifested for only the fifth time in the past three decades, according to market historians and institutional analysts [1]. This signal, which last appeared in 1996, 2000, 2007, and 2020, typically precedes significant directional shifts in equities, either upward or downward [1]. The current iteration follows a historic market turbulence that erased approximately 2300.000 billion from the Nasdaq on 6 November 2026, the worst single-day performance since April 2025 [3][5]. Analysts at The Motley Fool note that such patterns historically serve as precursors to extended momentum shifts and broad-market volatility, providing a quantitative context for capital allocators navigating corporate treasury risk and long-term equity exposure [1].
Market Context Leading to the Signal
The rare technical pattern emerged against a backdrop of heightened volatility and shifting macroeconomic conditions. On 6 November 2026, the S&P 500 declined by 0.044, the Nasdaq Composite by 0.052, and the Dow Jones Industrial Average by 0.034, marking a sharp reversal after gains earlier in the week [3]. The sell-off was led by technology stocks tied to AI infrastructure, with Oracle, Nvidia, Qualcomm, and Tesla experiencing declines ranging from 7% to 17% [3]. The 10-year Treasury yield dropped to 4.84% during this period, reflecting broader market unease [5]. Institutional strategists at JPMorgan have cautioned that Federal Reserve Chair Kevin Warsh, confirmed by the Senate in spring 2026, will face mounting pressure to address these market dynamics, with one strategist noting that Warsh must ‘spend less time looking out the window and more time walking the halls of Congress’ [3].
Political and Sectoral Undercurrents
The market turbulence coincides with political developments, including sweeping Democratic victories in the 2026 midterm elections, which have introduced new regulatory and social headwinds for data center construction—a critical component of the AI infrastructure build-out [2]. Meta president Dina Powell McCormick highlighted these challenges at the Wall Street Journal Tech conference on 4 November 2026, stating that the industry ‘is going to be harder’ due to voter unease and referendums targeting data centers, particularly in Texas [3]. Meanwhile, President Trump defended AI investments on social media, framing the sector as a strategic priority amid market recovery efforts [4]. However, the disconnect between political narratives and market realities underscores the volatility of current trading conditions.
Historical Precedents and Forward-Looking Implications
Historical comparisons to past market peaks—such as January 2000 and August 2007—suggest that the current technical signal may not herald the end of the bull market but rather a significant inflection point [5]. In 2000, the Nasdaq’s 49% advance in three months was followed by a 5.6% drop on 4 January and a nearly 10% decline by 6 January, culminating in a broader market correction [5]. Similarly, the VIX nearly doubled in the month leading up to 6 November 2026, with bearish sentiment dominating the AAII Investor Sentiment Survey (34% bulls, 48% bears) for 39 consecutive weeks [5]. While no indicator guarantees future movements, the recurrence of this rare pattern demands heightened vigilance from enterprise leaders and policymakers alike [1][GPT].
Sources
- www.fool.com
- www.facebook.com
- www.linkedin.com
- www.facebook.com
- henrikzeberg.substack.com
- www.facebook.com
- www.instagram.com