US Consumer Inflation Edges Up to 3.7 Percent While Core Pressures Hold Steady
Washington, Wednesday, 26 August 2026.
July’s 3.7% annual inflation tick slightly exceeded forecasts, but stable core price pressures matching expectations kept financial markets calm amid ongoing rate hike deliberations.
Headline Inflation Exceeds Expectations
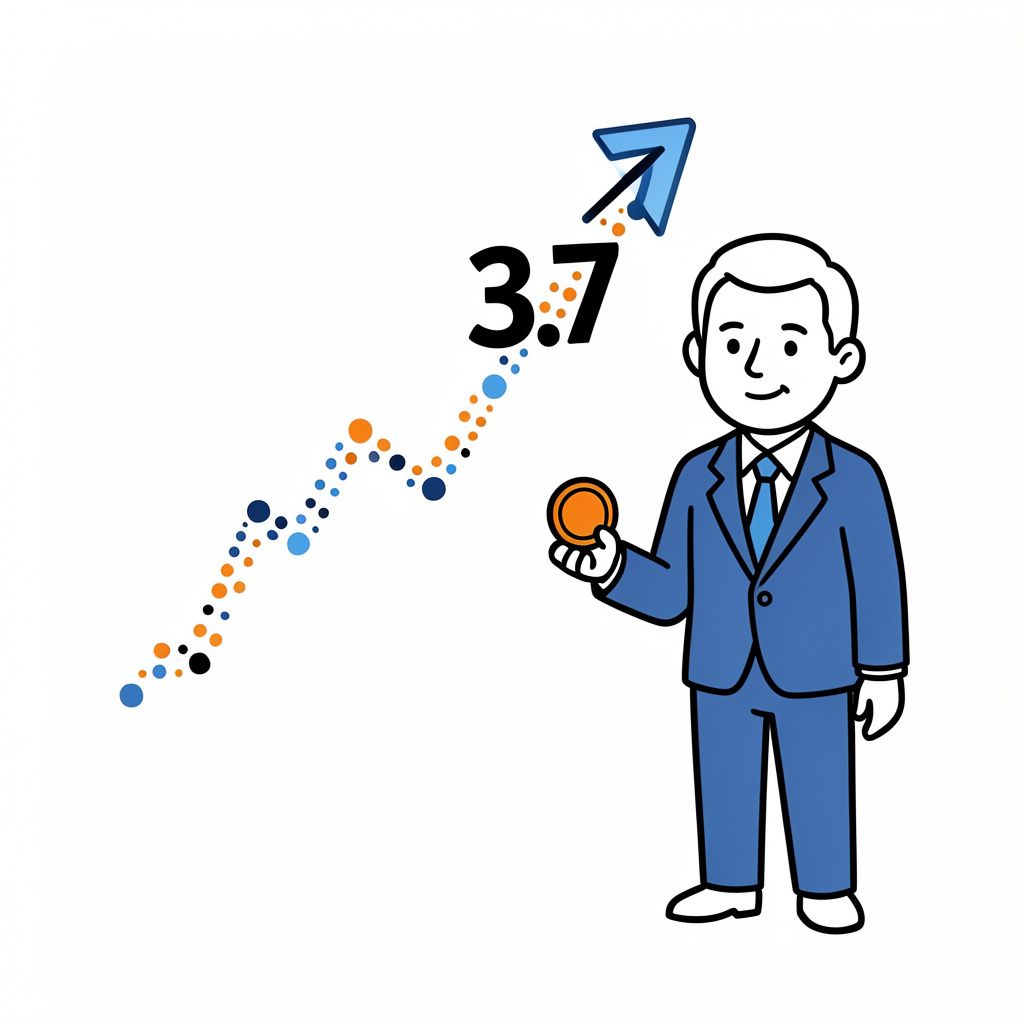
Following the previous analysis which noted core inflation stability [6], the latest Personal Consumption Expenditures (PCE) price index report reveals a slight uptick in headline inflation. Released on 26 August 2026, the data shows headline year-over-year inflation rising to 3.7%, surpassing the consensus estimate of 3.6% [1][2]. This deviation of 0.1 percent indicates a marginal acceleration in price levels compared to market forecasts [3]. Despite the headline increase, core PCE—which excludes volatile food and energy prices—met expectations precisely at 3.3% annually, suggesting underlying price pressures remain contained [2][5].
On a monthly basis, the PCE price index increased by 0.2% in July 2026, recovering from a 0.1% decline recorded in June [3][4]. Core PCE also rose by 0.2% month-over-month, aligning exactly with economist projections [1]. Financial markets exhibited minimal immediate volatility following the release, as investors interpreted the stable core measure as a sign that the Federal Reserve’s current policy path remains appropriate [1][4]. The divergence between headline and core metrics highlights the influence of energy and food sectors on the broader inflation narrative.
Consumer Spending and Income Dynamics
Underlying the inflation data, personal income demonstrated robust growth, increasing by $115.1 billion, or 0.4%, in July 2026 [2][5]. Disposable personal income (DPI) saw an even stronger rise, climbing by $125.9 billion, equivalent to a 0.5% increase [5]. This income growth supported a $36.3 billion rise in personal consumption expenditures, driven primarily by an $86.2 billion surge in services spending [2]. Conversely, goods spending decreased by $49.9 billion, partially offsetting the gains in the services sector [5].
Real PCE, which adjusts for inflation, increased by only $1.3 billion, representing less than 0.1% at a monthly rate [2][5]. The personal saving rate held at 3.0%, with total personal saving reaching $712.0 billion [5]. These figures suggest that while nominal spending is rising, real purchasing power growth remains modest. The shift towards services spending continues to be a dominant theme in consumer behavior, reflecting post-pandemic consumption patterns that prioritize experiences over goods [2].
Federal Reserve Policy Implications
The inflation data arrives as market participants assess the likelihood of further monetary tightening. Current market pricing indicates a 40% probability of a Federal Reserve interest rate hike in September 2026 [4]. While headline inflation exceeded forecasts, the adherence of core PCE to expectations may limit the urgency for aggressive policy shifts [1][4]. Investors are now looking toward the Jackson Hole Symposium scheduled for 27 August 2026 for further guidance on the central bank’s stance [4].
Global central banks are facing similar pressures, with the European Central Bank reportedly ready to raise rates in September due to high energy prices [4]. In the United States, the focus remains on whether the 3.7% headline rate proves transient or persistent. With the next Personal Income and Outlays report scheduled for 30 September 2026, policymakers will monitor incoming data to determine if additional measures are required to meet stability mandates [2][5]. The balance between controlling inflation and sustaining economic growth remains the critical challenge for the remainder of the year.