Americans Spend More on Local Hobbies as Soaring Flight Costs Curb Travel
New York, Sunday, 27 September 2026.
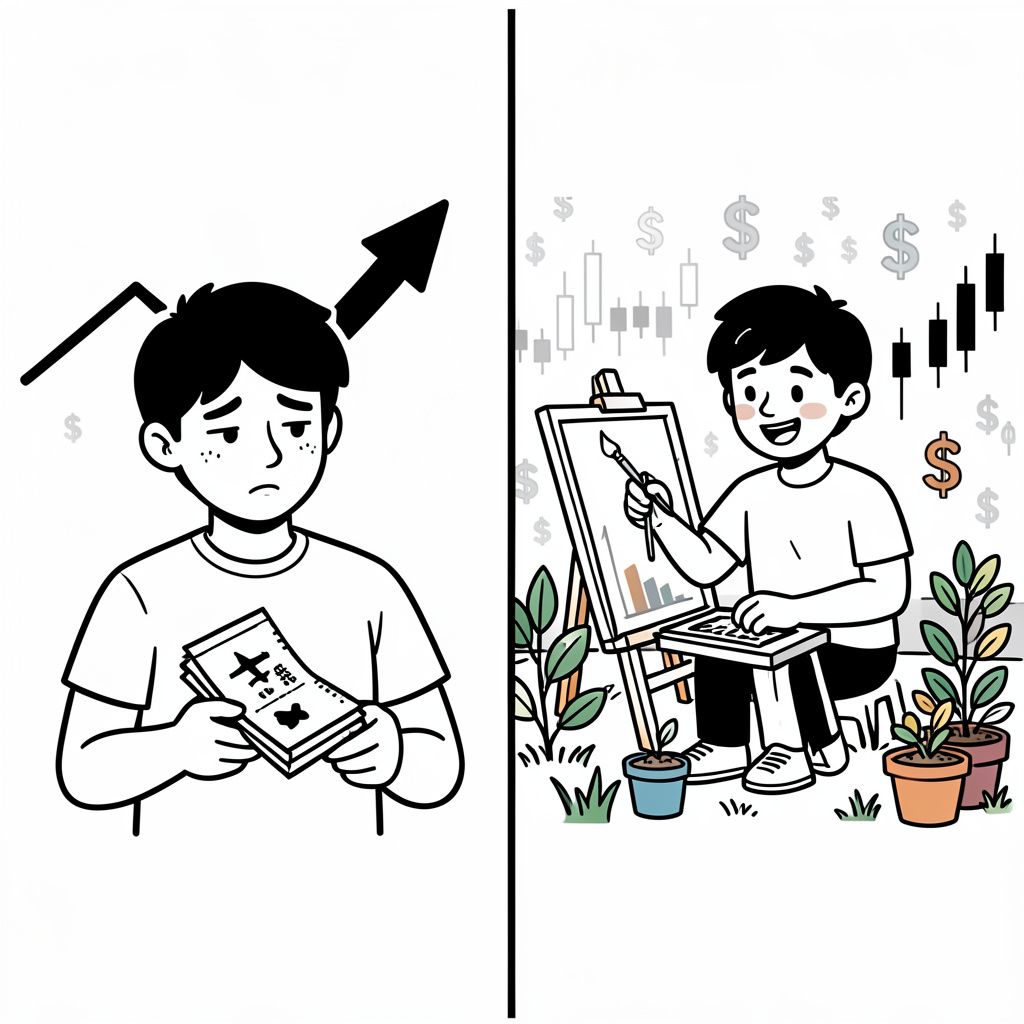
As rising jet fuel prices drive up airfares, Americans are foregoing expensive trips, boosting spending on hobbies by 7.9% to prioritize home-based recreation over travel.
The Rise of Funflation in the U.S. Economy
American consumers are increasingly redirecting discretionary spending toward personal hobbies as rising travel costs reshape the leisure landscape. According to a Bank of America analysis released on 26 September 2026, spending on hobbies such as arts, crafts, and outdoor gear grew by 7.9% year-on-year in August 2026 [1][2]. This surge significantly outpaces the 3.4% growth observed in total transactions during the same period [1]. The phenomenon, termed ‘funflation,’ reflects an economic shift where consumers prioritize localized, activity-driven expenditures over costly vacations due to elevated airfares [1][4]. While total U.S. retail and food-services sales grew by 6% in the 12 months through August 2026, sales at sporting goods, hobby, musical instrument, and book stores increased by 10.7% [1]. This divergence highlights a resilient demand within the leisure sector despite broader inflationary pressures affecting household budgets [1].
Travel Costs Drive Substitution Effects
The pivot toward home-based hobbies is closely linked to sharp increases in travel expenses. Jet fuel prices reached $194 per barrel for the week ending 18 September 2026, representing a 116% year-on-year increase [1]. Consequently, U.S. airfare prices rose by 26.5% year-on-year as of August 2026 [1]. John Gathergood, an economics professor at the University of Nottingham, notes that when prices rise, consumers might substitute between activities, such as replacing holidays away with more hobbies at home [1]. By foregoing travel abroad, consumers can free up substantial amounts of cash to spend on hobbies at home [1]. A PWC survey of over 2,000 adults conducted in April 2026 found consumers planned to spend an average of nearly $2,900 on travel during the summer, with 71% of respondents expecting to spend the same or more than the previous summer [1]. However, the actual spending behavior in August suggests a substitution effect is taking hold as costs materialize [1][3].
Generational Spending Shifts
Demographic analysis reveals distinct patterns in how different generations are navigating this economic environment. Bank of America analysis covering the three months ending August 2026 shows older millennials spent more than double per consumer on hobbies compared to Gen Z [1]. Despite this, both Gen Zers and millennials devote more spending on outdoor recreation than Gen Xers and baby boomers [3]. Across all generations, video game spending remained robust, indicating a broad-based commitment to entertainment despite cost pressures [3]. Issuers are actively trying to acquire younger consumers, and targeting their key interests for reward categories may offer a pathway for their loyalty [3]. To convert younger consumers’ desire for fun into cardholder loyalty, issuers need to embed experience-driven rewards that mirror their hobbies [3].
Economic Implications and Future Outlook
The recreation index reported by the Bureau of Labor Statistics rose 2.7% in the 12 months through August 2026, signaling sustained price pressure in the leisure sector [1]. Dan Wasiolek, a senior equity analyst at Morningstar, describes this trend as spending on experiences rather than ‘things,’ though the definition of experience is shifting toward accessible activities [1]. Bank of America analysts suggest that generations are likely gravitating most of their spending toward less expensive hobbies like arts, crafts, and board games [1]. It is also possible that this reflects a shift to more ‘granny core’ activities like knitting and sewing [1]. The difference in growth rates between hobby spending and total transactions is 4.5, indicating a strong preferential shift [1][2]. As consumers continue to balance budgets, the resilience of the hobby economy suggests a structural change in discretionary spending rather than a temporary fluctuation [1][4].
Sources
- www.cnbc.com
- intellectia.ai
- www.emarketer.com
- ground.news
- www.facebook.com
- x.com
- www.threads.com
- x.com