New York Economic Data Shows Widening Gap Between Wealthy and Struggling Households
New York, Monday, 17 August 2026.
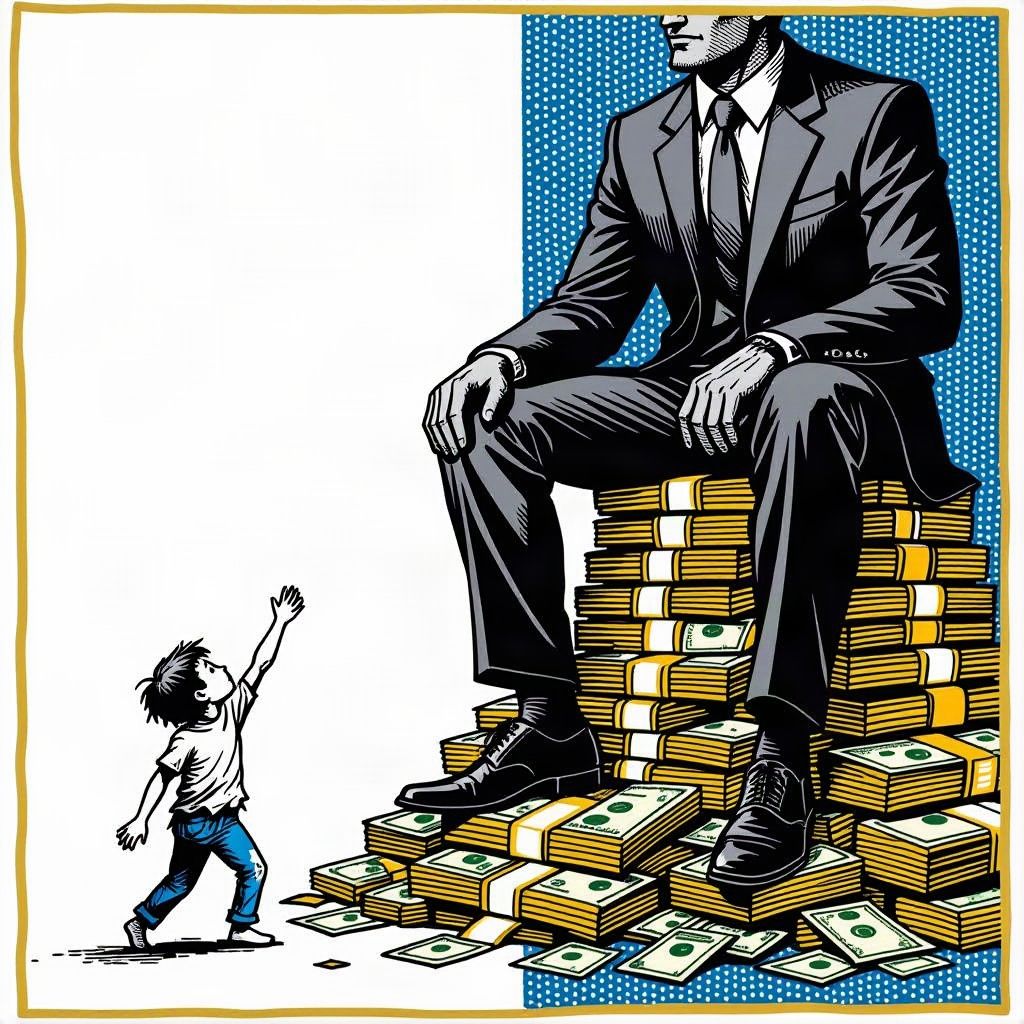
Despite federal claims of widespread prosperity, New York City data reveals extreme inequality: the top one percent captured 53 percent of recent income growth while local poverty doubled national levels.
Divergent Realities in Economic Data
New York City economic indicators released on 17 August 2026 reveal a stark contrast to federal assertions of broad-based prosperity [1]. While Treasury Secretary Scott Bessent stated on 4 August 2026 that the K-shaped economy had ended due to wage growth in low-paying sectors, local data suggests extreme polarization remains [1]. Analysis shows the wealthiest one percent of residents, approximately 40,700 millionaires, captured 53% of total income growth over the five-year period beginning in 2019 [1]. Conversely, poverty rates reached a record high in 2024, doubling the national average during the same timeframe [1]. This discrepancy highlights a critical disconnect between national macroeconomic narratives and localized financial experiences in major metropolitan hubs [1].
Housing Market Polarization
The housing sector exemplifies this economic divide, with distinct trends emerging between luxury and general markets [1]. While the overall housing market experienced an 8.2% loss over the year prior to 16 August 2026, the ultra-luxury segment for homes priced between $5 million and $10 million or more has proliferated [1]. Approximately 69% of NYC households are renters, facing increased pressure from housing unaffordability and lagging real wages [1]. Reliance on public safety nets has reached record levels, with increasing numbers of residents requiring cash assistance and SNAP benefits even as access to these programs declines for thousands of recipients [1]. Lakisha Morris, division director for food and housing stability at Catholic Charities, noted that even full-time workers struggle to afford grocery prices due to food inflation [1].
Consumer Behavior and Value Seeking
Broader consumer behavior patterns mirror the wealth disparity observed in New York, particularly within the fast-food industry [2]. McDonald’s reported $139 billion in systemwide sales in 2025, yet is losing market momentum to Burger King, which recorded $29 billion in systemwide sales during the same period [2]. The difference in sales volume between the two chains is 110 billion, yet momentum shifts indicate lower-income families are reducing consumption or migrating to chains with aggressive bargains [2]. During an earnings call on 6 August 2026, McDonald’s management addressed failures in its under-$3 value menu rollout, acknowledging they did not execute at the needed level [2]. This shift suggests that wealthier households continue spending while lower-income families constrain expenditures, forcing industry leaders to prioritize affordability to regain value-conscious market share [2].
Long-Term Economic Implications
Economists warn that these trends signal deeper structural issues beyond temporary market fluctuations [1]. Peter Atwater, an economist at William & Mary, stated that the K-shaped economy reflects how people feel about their life experience, with those at the top feeling invulnerable and those at the bottom feeling powerless [1]. James Parrott, senior advisor at the Center for New York City Affairs, noted that finance and tech growth coupled with wage stagnation makes the post-pandemic NYC economy more polarized than ever [1]. Mohamed Obaidy, an economist at the Center for NYC Affairs, described the situation as the almost-disappearance of the middle class, resembling characteristics of developing countries [1]. Without dramatic changes in policy or macroeconomic conditions, these forces are expected to remain underway, impacting consumer spending and labor dynamics regionally and nationally [1].