How Consumers' Refusal to Bargain Shop is Driving Record Corporate Profits
New York, Monday, 8 June 2026.
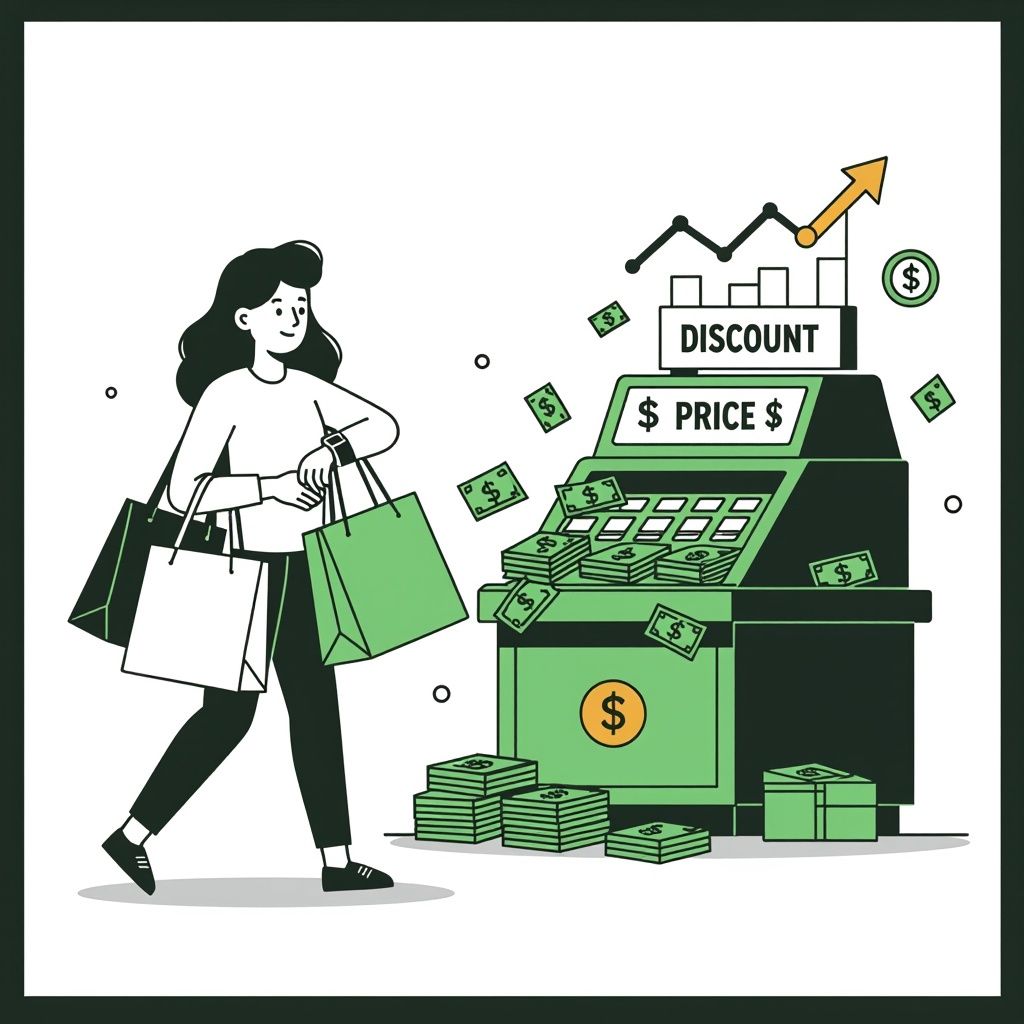
As rising incomes make shoppers value time over savings, US corporate profit margins have doubled to over 10%. Businesses are capitalizing on this trend to maintain high prices.
The Economics of Time Over Money
The structural shift in consumer behavior has fundamentally altered the corporate balance sheet. According to research from Goldman Sachs economists, after-tax corporate profits as a share of value added have roughly doubled, climbing from approximately 5% in the late 1980s to over 10% recently, representing a relative expansion of 100 percent [1]. This growth is largely driven by rising price markups alongside falling production costs [1]. As average incomes have risen over the decades, the opportunity cost of time has increased, prompting consumers to spend less time searching for the absolute lowest prices [1]. In fact, economist Kunal Sangani estimates that increases in average income and widening income inequality account for a roughly 8 percentage point rise in the aggregate retail markup between 1980 and 2018 [1]. Wealthier, less price-sensitive households now drive a larger share of total consumption, allowing firms to comfortably raise markups without sacrificing volume [1].
The Algorithmic Edge in Modern Retail
Retailers are not merely passively benefiting from this inelastic demand; they are actively exploiting it through sophisticated technology. Companies are increasingly deploying dynamic pricing algorithms that adjust online prices in real-time based on a myriad of factors, including supply, demand, inventory levels, competitor data, and individual consumer habits [2]. A June 6, 2026, investigation by CBS California revealed the stark reality of these fluctuations [2]. By monitoring online shopping carts between April 29, 2026, and May 26, 2026, investigators found that an Old Navy cart’s total price fluctuated by approximately 36%, swinging between a high of $225 and a low of $143 [2]. Notably, the cart experienced a sharp single-day decline from $201.46 on May 14 to $184.96 on May 15, representing a drop of -8.19 percent [2]. A similar test at Target saw a six-item cart fluctuate by more than 20%, while an Amazon cart also experienced continuous price adjustments [2].
The Costco Counter-Narrative
While dynamic pricing and expanding markups have become the industry norm, a few outliers demonstrate that alternative models can still yield massive success. Costco Wholesale Corporation has famously taken the opposite approach, strictly capping its markups at approximately 14% on national brands and 15% on its private-label Kirkland Signature products [4]. Rather than extracting maximum profit from every retail transaction, Costco relies on its annual membership fees for the bulk of its earnings [4]. This strategy has cultivated immense customer loyalty. By late 2024, the company’s membership renewal rate in the United States and Canada reached an impressive 92.8%, and it reported nearly $250 billion in revenue for fiscal 2024 [4].
Navigating the Macroeconomic Crosscurrents
The broader economic backdrop for the second quarter of 2026 presents a complex mix of signals for investors and policymakers alike. On one hand, the stock market continues to reward corporate profitability. On Tuesday, June 2, 2026, the S&P 500 index reached an intraday high of 7,620.90, ultimately closing the week up 7.9% year-to-date at 7,383.74 [1]. Meanwhile, consumers are finding slight relief in certain energy and housing sectors. The national average price of regular gasoline declined to approximately $1.17 per liter, which is a decrease of $0.03 per liter from the previous week, amid crude oil price drops linked to peace talks with Iran [1]. Additionally, average 30-year fixed-rate mortgages ticked down to 6.48% during the week ending May 28, 2026, prompting Freddie Mac to note that housing affordability is marginally improving as income growth outpaces home price growth [1].