United States Recession Odds Reach 49 Percent Amid Global Oil Shocks
New York, Monday, 30 March 2026.
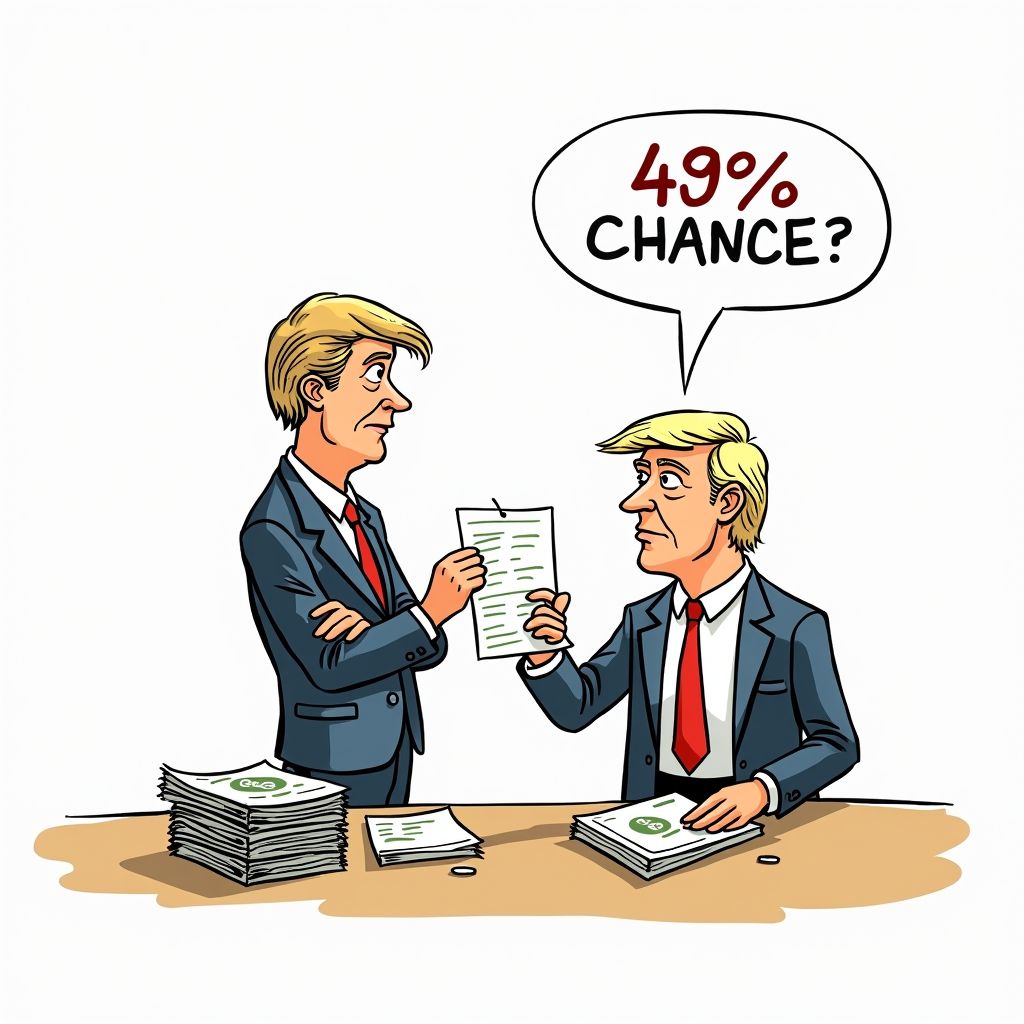
In March 2026, models indicate a 49% probability of a U.S. recession. This elevated risk is primarily driven by geopolitical conflicts severing 20% of global oil supplies.
Economic Indicators Flash Warning Signs
The macroeconomic landscape in early 2026 presents a complex puzzle for analysts, as shifting labor and output metrics point toward a potential contraction. Following a robust 2025 where the S&P 500 gained over 16% [2], recent data has turned decidedly soft [2]. The United States economy shed 92,000 jobs in the latest reporting period, pushing the unemployment rate up to 4.4% from its January 2026 level of 4.3% [2][5]. Concurrently, gross domestic product (GDP) [GPT] estimates were revised downward from 1.4% to 0.7% [2]. This weakening foundation has prompted major financial institutions to revise their outlooks. Goldman Sachs recently increased its 12-month recession probability forecast from 25% to 30% [3], while J.P. Morgan Research maintains a 40% probability for both a U.S. and global recession [5].
The Geopolitical Oil Shock
Complicating the domestic economic picture is a severe geopolitical crisis that has sent shockwaves through global energy markets. A war involving the United States and Iran has effectively choked off 20% of the world’s crude oil supply [2][4]. This disruption has sent oil prices soaring to nearly $120 per barrel (approximately 0.159 cubic meters) as of late March 2026 [2][GPT]. Historically, every U.S. recession since World War II—with the singular exception of the COVID-19 pandemic—has been preceded by a sudden spike in fuel prices [2]. Because Moody’s initial 49% probability estimate was based on data collected before the onset of the U.S.-Iran conflict, analysts warn that the odds of a recession could easily breach the critical 50% threshold if the war is not resolved quickly [2][4].
Market Valuations in Historic Territory
Equity markets have reacted sharply to these compounding risks. Since the start of the year, major U.S. indices have experienced significant sell-offs. As of late March 2026, the S&P 500 is down approximately 7% year-to-date, the Dow Jones Industrial Average has dropped about 8%, and the Nasdaq Composite has entered correction territory by plunging more than 10% from its earlier peak [1][2][4]. Despite these declines, key valuation metrics suggest the market remains historically overvalued. The S&P 500 Shiller CAPE Ratio currently sits close to 40, representing an inflation-adjusted valuation that is 135.294 percent above its long-term average of 17 [1][3]. This is the second-highest level ever recorded, trailing only the peak of 44 reached during the dot-com bubble in late 1999 [1][3].